|
V. Statistics Iterating any value z in the complex place produces a sequence of values z0, z1, z2… zn, and the magnitude of each term can be treated statistically. Mean, range, standard deviation, and other common statistical values can be calculated, and the values used directly for coloring.
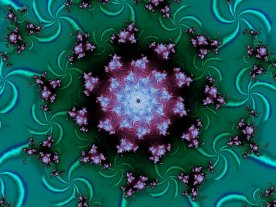
Figs. 4a and 4b. Both images show the same formula and region of the complex plane, but different coloring algorithms. Other more uncommon statistical methods, like the fractal dimension and Lyapunov exponent, can also be used, although these work best with bounded data sets. Sometimes it is possible to transform the unbounded magnitude of zn into a bounded data set by inverting it (1/zn).
VisMath Home |